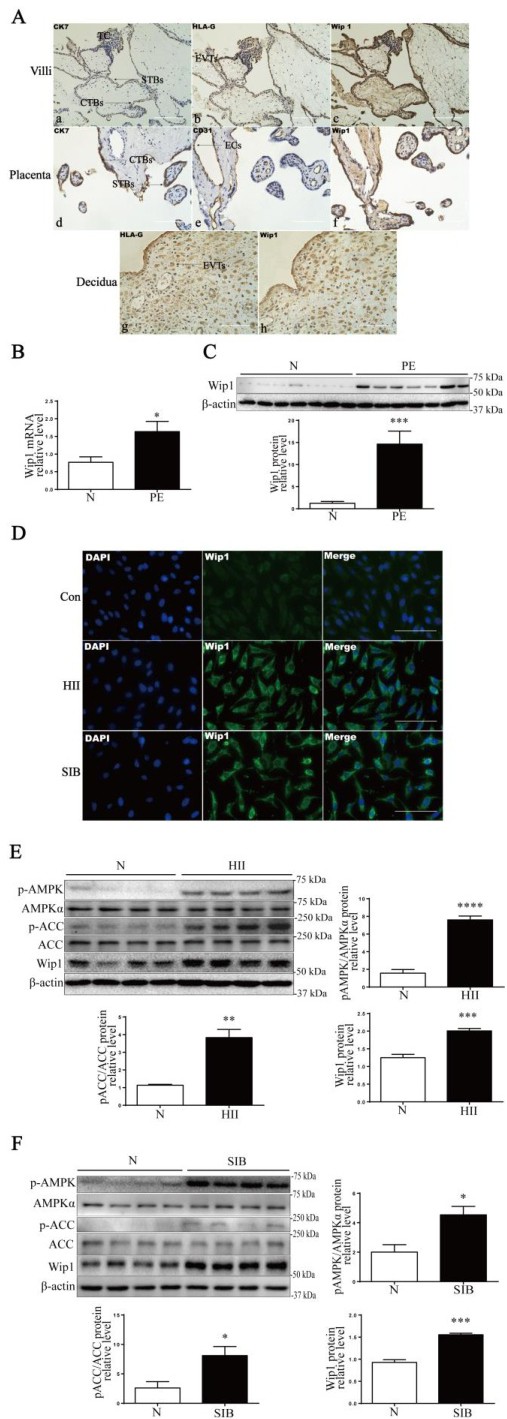
Fig. 1. Expression pattern of Wip1 is altered in PE placentas and trophoblastic PE models. A. IHC staining of CK7, CD31, HLA-G, and Wip1 in villous (a-c), term placental (d-f) and decidual (g-h) tissue from healthy pregnancies, to assess the expression patterns of Wip1 in endothelial cells (ECs), cytotrophoblasts (CTBs), syncytiotrophoblasts (STBs), extravillous trophoblasts (EVTs), and trophoblast columns (TCs). Scale bar, 200 µm; B. The mRNA levels of Wip1 in normal and PE placentas, n=7, *p<0.05, Student's t-test; C. The representative Western blot and quantification of Wip1 protein in normal and PE placentas, n=7, ***P<0.001, Student's t-test; D. IF staining of Wip1 (green) in HTR8/SVneo cells after 24 h of HII or SIB treatment, normoxia was included as control. Nuclei were counterstained by DAPI (blue). Scale bar, 100μ m; E-F. Phosphorylation levels of AMPKα and ACC, and Wip1 protein expression in HTR8/SVneo cells after 24 h of HII (E) and SIB (F) treatments were examined by Western blotting. n=4, *P<0.05, **P<0.01, ***P<0.001, Student's t-test. Experiments were performed in triplicate.